Mean, Median, Mode: What Each Average Really Tells You
Average is one of the most used and most misunderstood words in mathematics. A class average of 70 percent sounds simple, but it hides a world of detail: did most pupils score near 70, or did half the class score 95 and the other half 45? The three averages — mean, median and mode — answer different questions, and choosing the wrong one can make the same data tell a misleading story. This article uses data pupils can collect themselves — heights, marks, shoe sizes, travel times — to show what each average really tells you, what each one hides, and how to choose between them. No invented statistics are used: every example is either clearly illustrative or built from data the class gathers itself.
Three Averages, Three Different Questions
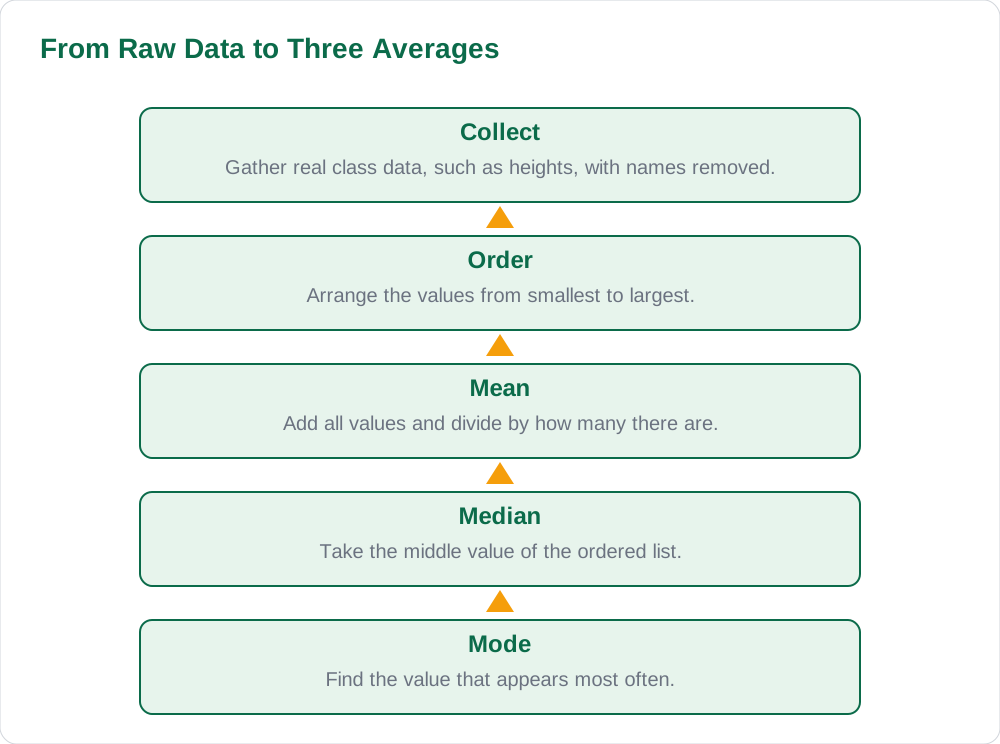
The mean is the average most people mean when they say average: add up all the values and divide by how many there are. The median is the middle value when the data is arranged in order — half the values are above it and half below. The mode is the most common value, the one that appears most often. These are not three ways of saying the same thing; they are three different questions. The mean asks: what would each value be if the total were shared equally? The median asks: what is the middle of the pack? The mode asks: what is the most popular value?
A quick example shows why the distinction matters. Take the illustrative marks 40, 50, 60, 70 and 180 — the last one an unusually high outlier, perhaps a bonus-adjusted total. The mean is 80, the median is 60, and there is no mode. The mean of 80 suggests a strong class, but four of the five values are 70 or below; the median of 60 describes the typical pupil far better. Pupils who can tell this story about a small data set understand averages better than pupils who can only compute them. The solved notes on this site use the same tell-the-story approach, and the books page lists the official texts to check against.
- Mean: total divided by count — the equal-share average.
- Median: the middle value in ordered data — half above, half below.
- Mode: the most frequent value — the popular choice.
- The three averages answer different questions, so they can disagree.
Collecting Real Class Data: Heights and Marks
The best statistics lesson starts with data pupils helped to create. Ask the class to record their heights in centimetres, anonymously on slips of paper, and the teacher builds the data set live. Pupils compute the mean height, find the median by ordering the values, and spot the mode if one height repeats. Because the data is theirs, the answers matter: the median height is the height of the middle pupil, and the mode is the most common height in the room. Abstract definitions become descriptions of real classmates, and the lesson is remembered.
Marks data works just as well, and it teaches an important lesson about privacy and care. Use last week's quiz marks without names attached, and discuss the averages as a class: does the mean describe the typical score, or is one very low score pulling it down? Pupils quickly learn that averages describe groups, not individuals, and that a single average never tells the whole story. Teachers should always present at least two averages side by side, because the comparison between them is where the real understanding lives.
The Mean: Powerful but Easily Pulled
The mean's strength is that it uses every value, so it responds to the whole data set. Its weakness is the same property: one extreme value can drag it far from the typical value. A class where most pupils score 50 to 60 but one pupil scores 100 has a mean pulled upward, and a class with one very low score has a mean pulled downward. Pupils should learn to ask, whenever they see a mean: is anything extreme hiding in this data? If the answer is yes, the median probably tells the more honest story.
The mean is the right choice when the data has no extreme values and when the total matters — for example, when working out the total runs a cricket team needs, or the average rainfall over a month. It is also the average that works best in further calculations, which is why it dominates science and economics. Teachers can show this with the class height data: the mean height times the number of pupils equals the total of all heights, a property the median does not have. Understanding what the mean is for — sharing a total equally — is more valuable than the formula alone.
Median and Mode: The Middle and the Most Common
The median is the honest average when data has outliers. To find it, order the values and take the middle one; with an even number of values, take the mean of the two middle ones. The median ignores extremes, which is why it is used for house prices and incomes, where a few very large values would distort the mean. Pupils can feel the difference by ordering their own height data: the median is the height of the pupil standing in the middle of the line, a concrete image that stays with them.
The mode is the average of popularity. It answers questions like: which shoe size should the school shop stock most, or which bus is most crowded? It is the only average that works for categories that are not numbers, such as favourite subject or most common mode of transport to school. The mode's weakness is that it can be absent, when no value repeats, or multiple, when two values tie. Pupils should learn that a data set can have no mode, one mode, or two modes, and that this is normal, not a mistake.
- Median with an even count: average the two middle values.
- Median is best when outliers would distort the mean.
- Mode works for categories, not just numbers — favourite subject, transport type.
- A data set can have no mode, one mode, or two modes.
Choosing the Right Average and Avoiding Misleading Claims
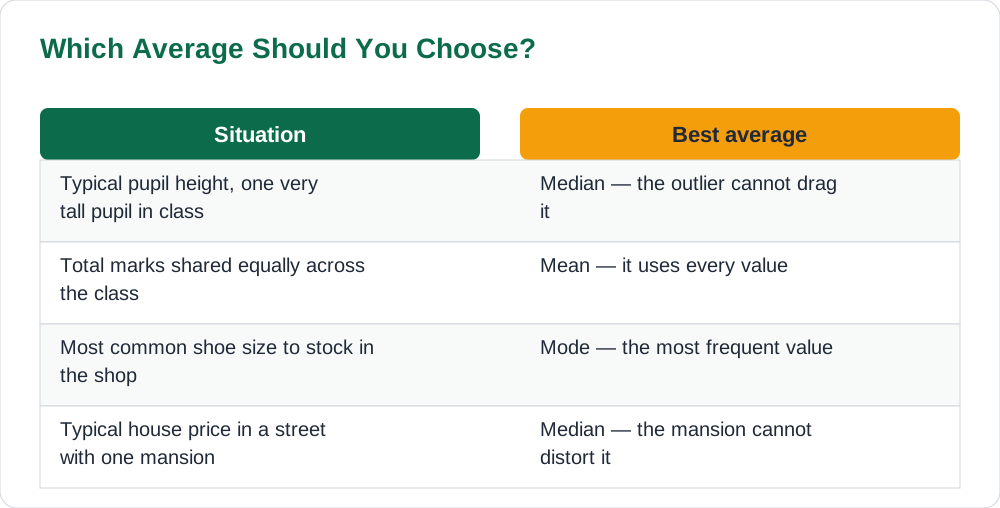
Choosing an average is a judgement, not a reflex. If the question asks for the typical value and the data has outliers, choose the median. If the question asks for the total shared equally, choose the mean. If the question asks for the most common value or category, choose the mode. Pupils who can justify their choice in one sentence — I chose the median because one very high score would distort the mean — have understood averages at the level that matters. In exams, that justification is often worth as much as the calculation.
Pupils should also learn to spot misleading averages in the wider world. A company advertising an average salary can legally report a mean inflated by a few high earners, when the median salary is far lower. A shop advertising average savings can pick the average that sounds biggest. The defence is simple: ask which average, and ask what the data looks like. A single average without the rest of the picture is a claim to check, not a fact to accept. That sceptical habit is one of the most useful things statistics teaches, and it lasts far beyond school. For more data sense, see the guide to checking maths answers in exams, and browse the blog.
AI Help: Muse AI
Muse AI is Meta's personal AI assistant, and it can help with this topic by finding the mean, median and mode of a data set you describe, or by explaining in plain words which average best describes a set of class marks.
Join Muse with invite code LTGSWD — in the Muse app, go to Settings > Redeem token and enter the code.
Disclosure: LTGSWD is the author's Muse invite code.
Muse AI does not give official STBB answers — always verify against your Sindh Textbook Board book and your teacher.
5 key points you must know
- Mean: total divided by count — the equal-share average, sensitive to outliers.
- Median: the middle value in ordered data — robust against extreme values.
- Mode: the most frequent value — the only average that works for categories.
- Collect real class data so the averages describe real pupils, not abstract numbers.
- Choose the average that matches the question, and always ask which average a claim uses.
Frequently asked questions
What is the difference between mean, median and mode?
The mean is the total divided by the count. The median is the middle value when data is ordered. The mode is the most common value. They answer different questions — equal share, middle of the pack, and most popular — so they can give different answers for the same data.
Which average should I use if there is an outlier?
Usually the median, because an outlier pulls the mean but leaves the median nearly unchanged. For example, in the illustrative marks 40, 50, 60, 70 and 180, the mean is 80 but the median is 60, and 60 describes the typical pupil far better.
Can a data set have no mode?
Yes. If every value appears exactly once, there is no most common value, so there is no mode. A data set can also have two modes if two values tie for the highest frequency. Both situations are normal and should be reported honestly.
How do I find the median with an even number of values?
Order the values, take the two middle ones, and find their mean. For example, in 10, 20, 30, 40, the two middle values are 20 and 30, so the median is 25. This keeps the median exactly in the middle of the ordered list.
Why do advertisers sometimes use the mean instead of the median?
Because the mean can sound bigger when a few high values pull it upward — for example, a mean salary inflated by a few top earners. Always ask which average is being reported and what the data looks like. A single average without context is a claim to check, not a fact to accept.
Solved notes — preview free
These guides work best with the solved exercises. Preview the solved notes free on this website — 119 solved notes for Classes 6–10 in Sindhi, Urdu, English and Arabic medium. Or browse the full solved notes catalogue for your class and medium. New solved notes are added regularly — check the catalogue for coming-soon books.